To view tables and graphs referred to in the errata, please log in.
| p. 26 | Values for the RMS errors should be $4588 for the validation data (instead of $5337) and $4790 for the training data (instead of $4518). In this example, the sample size is quite small, and contrary to expectation, the training RMS just happens to be slightly higher than the validation RMS. |
| p. 32 | Problem 2.6 - In the first sentence, drop the word "prior." |
| p. 32 | Problem 2.9 - "square route" should be "square root". |
| p. 42 | In the middle of the page, change the two instances of 44% to 34%. |
| p. 45 | In the second line from the top, change 88% to 86%. |
| p. 51 | Problem 3.2 - After "...summarize the data as follows:" add (note that a few records contain missing values; since there are just a few, a simple solution is to remove them first. You can use the "missing data handling" utility in XLMiner) |
| p. 56 | Table 4.2: Top left cell should be 106 (rather than 250). All other cells are nearly accurate. Below is the completely accurate table: 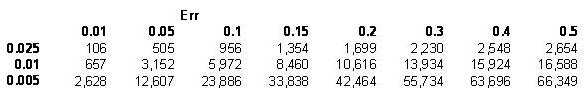 |
| p. 64 | In the middle of the page, change the sentence "A classifier that..." to "A classifier that misclassifies 2% of buying households as nonbuyers and 20% of the nonbuyers as buyers...". This is in agreement with the table below. |
| p. 66 | In the Note section near the bottom of the page, the example formula is missing a minus sign, it should read: ... a list of 10,000 is (0.02 x $25 x 10,000) - ($0.65 x 10,000) |
| p. 70-1 | Although it's not really wrong, the confusion tables on these pages have actuals along the top and predicteds along the side, the opposite of the way they're arranged in the rest of the book and in XLMiner. |
| p. 71 | In the line above the table, it should be "3.545 predicted 0's for every predicted 1". |
| p. 73 | In the last paragraph, $885,883 should be replaced with $835,883. Figure 4.13 which shows lift and decile charts for training data, should be replaced with the validation data charts: 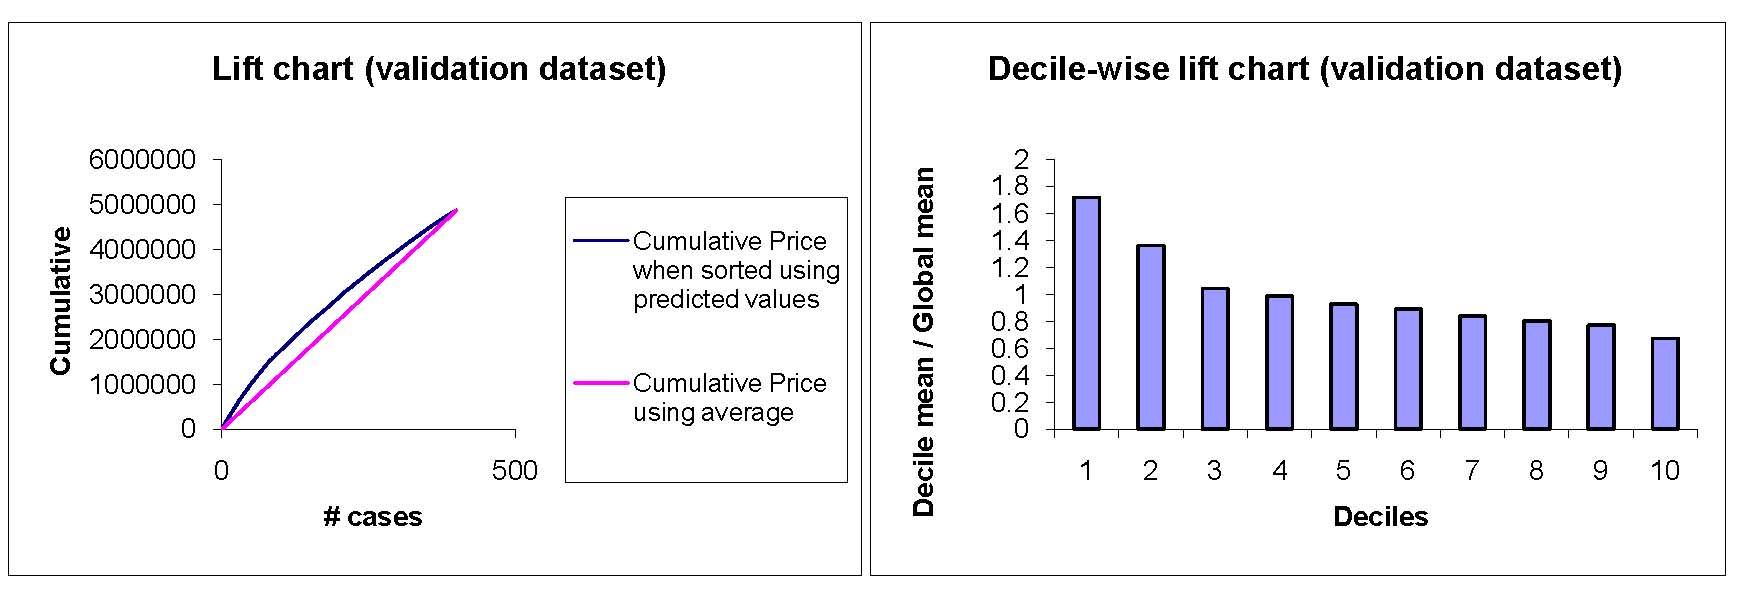 |
| p. 77 | The data used in this example are the first 1000 cars from the dataset ToyotaCorolla.xls. |
| p. 86 | Problem 5.1 c - Take the number of rooms per house as 6, rather than 3. |
| p. 87 | Table 5.4 describes the variables to be used in the problem; the file has additional variables. 5.2.c.i - The categorical variables are binary variables, so there is no need to create dummy variables from them. |
| p. 88 | 5.3 c.i and ii - The dummy variables should be created before partitioning, not after. |
| p. 89 | 5.3.c.v and ix - In the second part of the question, predictive interval" can be ignored as it is not covered in the chapter. |
| p. 96 | In the last line of the second paragraph, parentheses are missing. It should be 0.05/0.18 = (50/180)/(180/230). |
| p. 109 | 6.2.c - Ignore the suggested percentages (60%:40%), as XLMiner's limits will not permit that many training records. |
| p. 113 | In section 7.3, "the p-dimension6al" should be "p-dimensional" |
| p. 122 | This is the tree for the previous example, not the current example. |
| p. 125 | This page is mistakenly numbered as p. 25 |
| p. 130 | The data used in Section 7.8 are the first 1000 cars from the dataset ToyotaCorolla.xls. |
| p. 132 | In section 7.9, "the are senstive to changes" should be "they are sensitive to changes" |
| p. 134 | Problem 7.1.g - The first sentence should read "...about the chances of an auction obtaining at least two bids..." instead of "...about the chances of an auction transacting..." |
| p. 135 | Problem 7.2.c.v - The first sentence should read "...about the chances of an auction obtaining at least two bids..." instead of "...about the chances of an auction transacting..." |
| p. 135 | Problem 7.2 - Add the following just before the sentence that begins "This will avoid treating...": After binning DEP_TIME into 8 bins, this new variable should be broken down into 7 dummies (because the effect will not be linear, due to the morning and afternoon rush hours). |
| p. 135 | Problem 7.2 (a) Add the following as the second and third sentences: Do not include DEP_TIME (actual departure time) in the model because it is unknown at the time of prediction (unless we are doing our predicting of delays after the plane takes off, which is unlikely). In the third step of the Classification Tree menu, choose "Maximum # levels to be displayed = 6". |
| p. 136 | Problem 7.3 (b) Add the following sentence at the end of the paragraphs, before (i): Select "Normalize input data". |
| p. 142 | Equation (8.9): the intercept should be -6.3525 (not -6.5325). |
| p. 145 | The left-hand side of the equation in the middle is upside down. The x1+1 term should be in the numerator, and the x1 term should be in the denominator. |
| p. 151 | In the last two lines of the second paragraph, parentheses are missing. They should be (D0-D)/D0 and D0=D/(1-R2). The same error appears in line 5 of page 158. |
| p. 154 | Table 8.3 is not based on the correct dataset. The corrected table is: 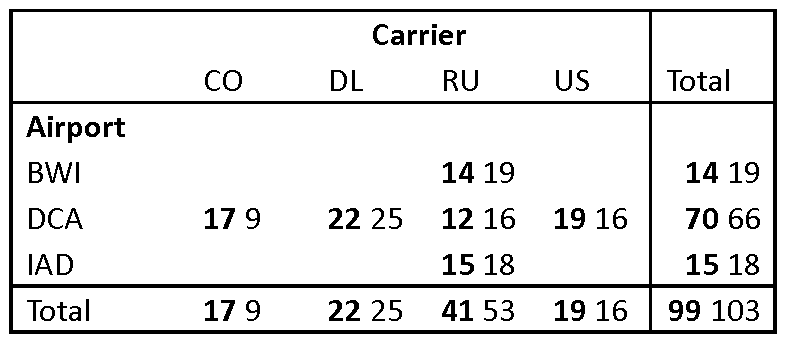 |
| p. 158 | In the 12th line of the Variable Selection section, it should be "only 7 predictors" |
| p. 163 | Problem 8.2 - In the second paragraph ignore the first sentence ("Using these data, the consultant performs a discriminant analysis"). |
| p. 163 | Problem 8.2, parts (a) and (d) - The references should be to "Training," not "Education". |
| p. 164 | Problem 8.3 (d) - Replace "households" with "nonowners". |
| p. 174 | Figure 9.4, bottom most table, the six 1 values in the "Predicted Class" column should be zeros. The rest of the output is correct (the error is due to an earlier output bug in XLMiner that has been fixed). |
| p. 176 | Example 2 - The subset of 999 accidents used in this example comprises of a non-random subset of the accident data set, taken from an area with a high fatality rate. |
| p. 177 | In the last paragraph before "Avoiding Overfitting" Section, "one pass of the data" consists of 600 iterations (not 150). |
| p. 192 | The "Predicted Class" column in Figure 10.4 is incorrect. The correct corresponding labels are given in Figure 10.5, on the next page. |
| p. 196 | Second paragraph in section 10.7 "...using the classification function coefficients. This can be seen in Figure 10.4" should be Figure 10.9. The next sentences should read: "For instance, the no-injury classification score for the first accident in the training set is -24.51+1.95(1)+1.19(0)+...+16.36(1)=31.42. The non-fatal score is similarly computed as 30.93... Since the no-injury score is highest, this accident is (correctly) classified as having no injuries". |
| p. 199 | In Figure 10.9, the two header labels "Score of no-injury" and "Score of non-fatal" (columns 4,5 titles) should be switched. |
| p. 219 | Paragraph 1, last sentence - "Mendeleeyev's" should be "Mendeleev's". |
| p. 225 | The right-hand side of the formula for r2 is actually the formula for the correlation, not its square. |
| p. 227 | A more precise specification for centroid distance is: distance (Xbar_A, Xbar_B). |
| p. 227 | Just prior to the two bullet points at the bottom of the page, at the end of the prior paragraph, add: "The distance measure used in the calculations that follow is Euclidean distance." |
| p. 229 | min(0.77,1.47) should be replaced with min(0.77,1.02), to be consistent with Table 12.3. |
| p. 237 | problem 12.1.c - The following should appear at the end: Hint: To obtain cluster statistics for hierarchical clustering, use Excel's pivot table on the "Predicted Clusters" sheet. |
| p. 238 | problem 12.3.a - The second sentence should read "Compare the dendrograms from single linkage and complete linkage, and look at cluster centroids.". The following should appear at the end: Hints: (1) To obtain cluster centroids for hierarchical clustering, use Excel's pivot table on the "Predicted Clusters" sheet. (2) Running hierarchical clustering in XLMiner is an iterative process -- run it once with a guess at the right number of clusters, then run it again after looking at the dendrogram, adjusting the number of clusters if needed. |
| p. 238 | Problem 12.4.a - Should read "Apply hierarchical clustering with Euclidean distance and Ward's method." |
| p. 246 p. 247 |
Table 13.2 - The "Rcode=" header for each sub-table needs to be renumbered, as follows: Top table on each page should be Rcode=all, second table is Rcode=1, third table is Rcode=2, fourth table is Rcode=3, fifth table is Rcode=4. |